Restaurant Self-Service Kiosk vs QR Ordering: Which Should You Choose?

Self-service kiosks and QR ordering both promise faster service and reduced labor costs. Research from QSR Magazine shows they solve the problem differently, and the right choice depends on your restaurant type, customer base, and operational priorities. This guide compares both technologies across every dimension that matters.
After analyzing deployments across hundreds of restaurants, the answer isn't always obvious. Some environments clearly favor one approach; others could succeed with either. Let's find where you fit.
Quick Comparison: Kiosks vs QR Ordering
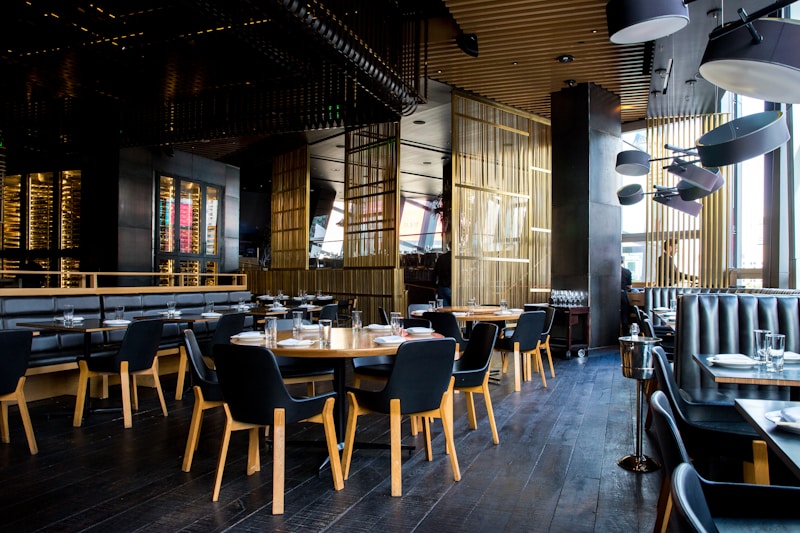
 Each technology suits different restaurant environments
| Factor | Self-Service Kiosks | QR Ordering |
|---|---|---|
| Upfront cost | $3,000-8,000/unit | $0-500 |
| Monthly fees | $100-300/unit | $0-150/location |
| Order capacity | 60-120/hour/unit | Unlimited |
| Customer adoption | 70-85% | 50-75% |
| Upselling increase | 15-25% | 8-15% |
| Best for | High volume, QSR | Sit-down, casual |
1. Understanding the Core Technologies
 Different technologies with distinct strengths and trade-offs
Before comparing specifics, understand what each technology actually does:
Self-Service Kiosks
Physical terminals where customers browse menus, customize orders, and pay. Kiosks resemble large touchscreen computers positioned in your restaurant, typically near the entrance or ordering counter.
The customer journey:
- Approach kiosk
- Browse menu on large touchscreen
- Customize items and add to cart
- Review order and pay
- Receive order number
- Wait for order fulfillment
QR Code Ordering
Customers scan a QR code with their smartphone to access a digital menu. They order and pay from their own device, either at the table or anywhere in the restaurant.
The customer journey:
- Scan QR code with phone
- Browse menu on personal device
- Customize items and add to cart
- Review order and pay
- Receive confirmation
- Wait for order delivery or pickup
Key Distinction
Kiosks provide the hardware; QR ordering leverages customers' existing devices. According to Modern Restaurant Management, this single difference cascades into significant implications for cost, maintenance, customer experience, and operations.
2. Cost Comparison: Investment and Ongoing
 QR ordering costs 90%+ less upfront but ROI varies by environment
Cost differences are dramatic. Let's break them down completely.
Self-Service Kiosk Costs
Hardware:
- Basic kiosk:
$3,000-5,000 - Premium kiosk:
$6,000-10,000 - Payment terminal: Often included or
$200-500additional - Installation:
$200-500per unit
Software:
- Platform subscription:
$100-300/month per kiosk - POS integration: Often included or one-time fee
- Updates and support: Typically included in subscription
Maintenance:
- Screen cleaning: Daily staff task
- Hardware repairs:
$200-1,000per incident - Replacement reserve:
$50-100/month recommended
3-kiosk deployment:
- Initial:
$12,000-25,000 - Monthly:
$300-900 - Annual total (Year 1):
$15,600-35,800
QR Ordering Costs
Hardware:
- QR code printing:
$10-50 - Table stands/cards:
$50-200 - No other hardware required
Software:
- Platform subscription:
$0-150/month per location - Many free tiers available
- Premium features at higher tiers
Maintenance:
- Replace worn QR codes:
$10-20/month - No hardware maintenance
Single location deployment:
- Initial:
$60-250 - Monthly:
$0-150 - Annual total (Year 1):
$60-2,050
Cost Ratio
QR ordering costs 10-50x less than kiosk deployment. However, cost isn't everything—capability differences may justify the investment.
3. Customer Experience Differences
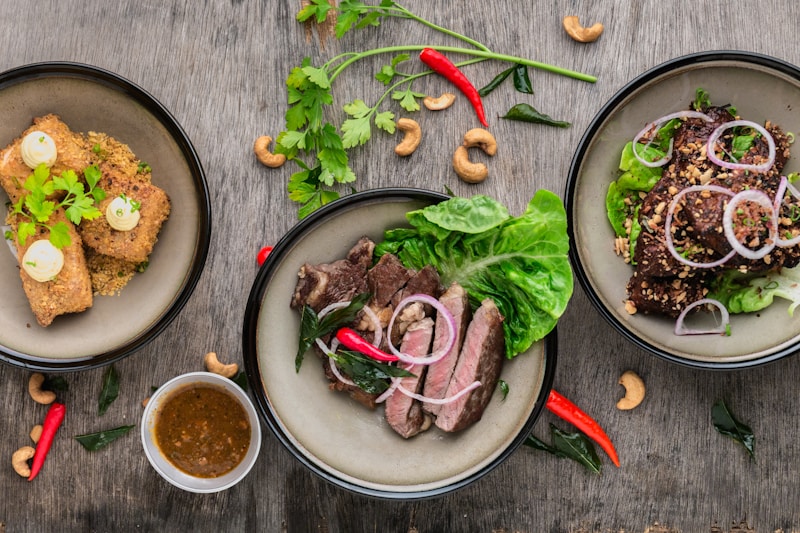
 Customer preferences vary significantly by demographic and context
Technology means nothing if customers don't use it effectively. Each approach creates different experiences.
Kiosk Customer Experience
Advantages:
- Large screen displays menu beautifully
- No personal device required
- Standardized interface everyone uses
- Physical presence guides customers naturally
- Works regardless of customer's phone situation
Disadvantages:
- Requires walking to kiosk location
- Lines form during peak times
- Surfaces touched by many people
- Less personal than table-side ordering
- May feel impersonal or corporate
QR Ordering Customer Experience
Advantages:
- Order from your seat
- Personal device feels comfortable
- No shared surfaces
- Multiple people can browse simultaneously
- Save favorites, reorder easily
Disadvantages:
- Requires smartphone and data/WiFi
- Small screens limit visual impact
- Technology comfort varies dramatically
- QR code fatigue is real for some demographics
- Battery and connectivity dependencies
Adoption Rates by Demographic
Research shows meaningful differences:
| Age Group | Kiosk Adoption | QR Adoption |
|---|---|---|
| 18-34 | 85% | 78% |
| 35-54 | 80% | 62% |
| 55-70 | 68% | 41% |
| 70+ | 45% | 22% |
Younger customers adapt to both; older customers strongly prefer kiosks if they'll use technology at all.
4. Impact on Average Check Size
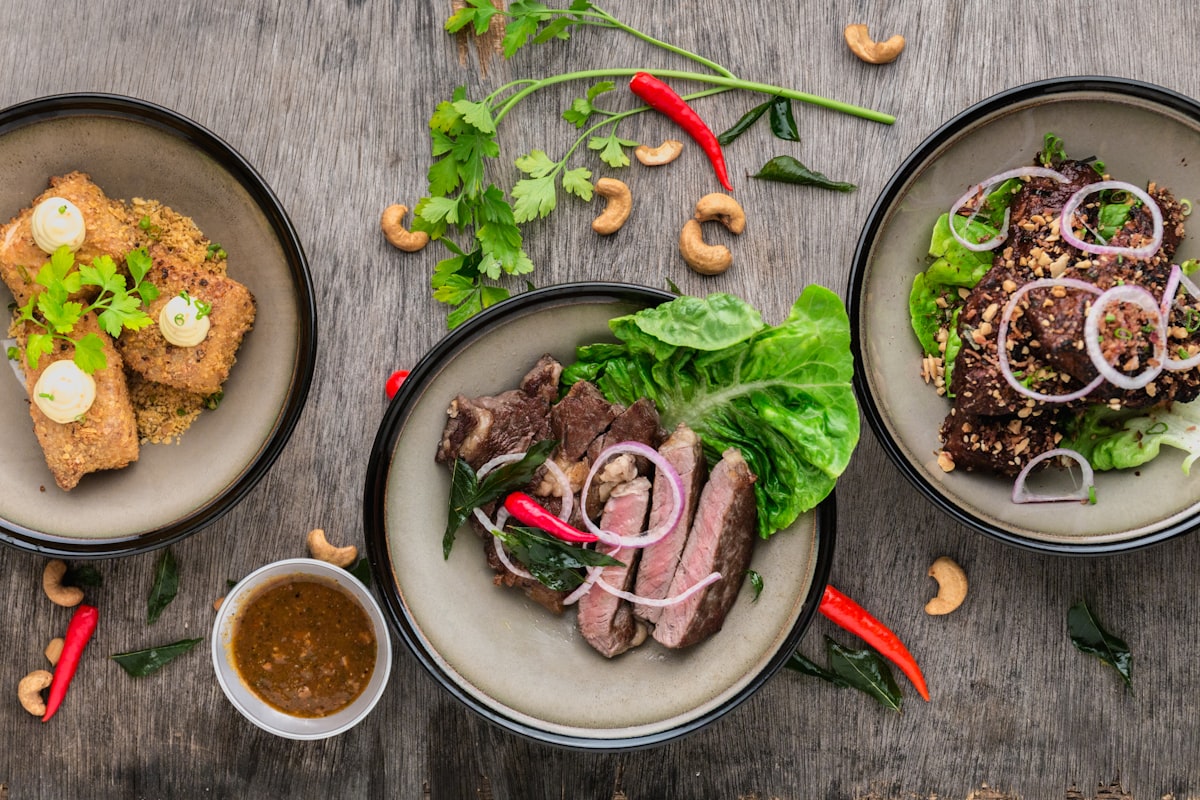
 Both technologies increase average check, but kiosks typically win
Self-ordering consistently increases average check size. The technologies perform differently, though.
Why Kiosks Excel at Upselling
Screen real estate: Large displays show appetizing photos effectively. Every item can include visual prompts.
Structured flow: Kiosk interfaces guide customers through ordering sequences that naturally include add-on prompts.
No social pressure: Customers add items without worrying about judgment from servers.
Reported increases: 15-25% average check growth
Why QR Ordering Still Performs Well
Browsing time: Customers at tables can browse extensively, discovering items they'd miss in quick counter interactions.
Reordering ease: "Add another round" buttons increase beverage sales.
Reduced friction: Adding items doesn't require flagging a server.
Reported increases: 8-15% average check growth
Why the Gap?
Kiosk interfaces control the experience. Developers optimize every screen for maximum conversion. QR menus compete with phone distractions—notifications, messages, other apps.
McDonald's reports 20%+ check increases from kiosks. QR-focused restaurants typically report 10-12% increases.
5. Operational Impact: Staff and Workflow
 Both technologies reduce order-taking labor but affect workflows differently
The labor-saving promise drives many adoption decisions. Reality varies by implementation.
Kiosk Operational Impact
Order taking:
- Eliminates counter order-taking for kiosk users
- Peak periods still need staff for customer assistance
- Typical reduction: 1-2 FTE positions per shift
New tasks created:
- Kiosk maintenance and cleaning
- Customer assistance at kiosks
- Order fulfillment tracking
Workflow changes:
- Kitchen receives more orders simultaneously
- Order timing becomes more variable
- Staff shift toward fulfillment from order-taking
QR Ordering Operational Impact
Order taking:
- Reduces server time per table significantly
- Works alongside traditional ordering
- Typical reduction: 0.5-1 FTE per shift
New tasks created:
- Table tech support for customers
- Device maintenance is minimal
- Order monitoring across more channels
Workflow changes:
- Orders arrive continuously, not in batches
- Table assignment becomes more important
- Payment is often completed before food arrives
Net Labor Impact
Kiosks: Larger absolute labor savings but require capital investment. Best ROI in high-volume environments where the savings compound.
QR Ordering: Smaller per-table savings but much lower implementation cost. Better ROI for smaller operations or those testing self-service.
6. Best Fit: Restaurant Types Analysis
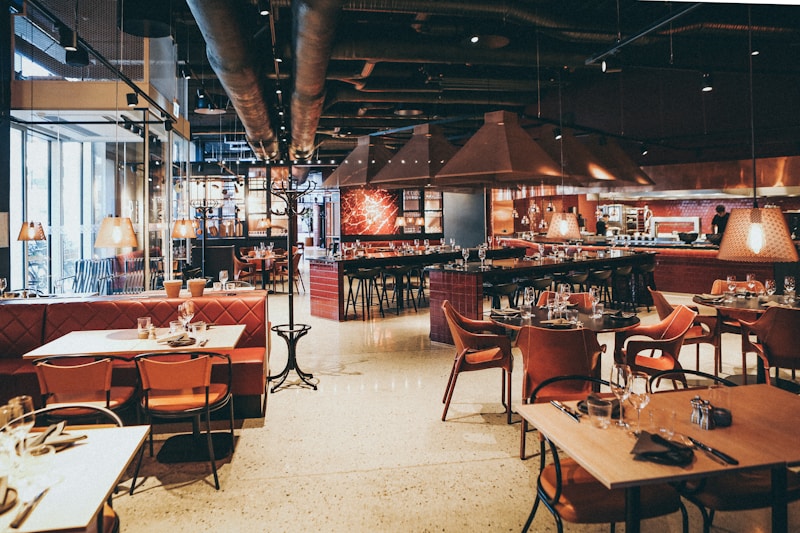
 Different restaurant formats favor different technologies
Matching technology to restaurant type dramatically affects outcomes.
Quick-Service Restaurants (QSR)
Best fit: Kiosks
QSR environments favor kiosks:
- Standing ordering suits kiosk placement
- High volume justifies investment
- Speed is critical metric
- Customer base expects self-service options
- Counter space available for units
McDonald's, Panera, and similar chains demonstrate success at scale.
Fast Casual
Best fit: Either/Both
Fast casual restaurants can succeed with either approach:
- Kiosks work for counter-service models
- QR ordering works for table-service models
- Hybrid deployments are common
- Customer comfort with both technologies
Consider your specific ordering model more than industry category.
Casual Dining
Best fit: QR Ordering
Seated dining environments favor QR:
- Guests are already at tables
- Social dining benefits from shared browsing
- Kiosk trips interrupt the experience
- Lower volume reduces kiosk ROI
- QR enables table payment convenience
Fine Dining
Best fit: Neither (or QR for specific uses)
Fine dining typically resists both:
- Personal service is the value proposition
- Technology can feel inappropriate
- If used, QR for wine lists or specific functions
- Kiosks never appropriate
Bars and Nightclubs
Best fit: QR Ordering
High-energy environments favor QR:
- No space for kiosks in crowded venues
- Customers have phones in hand already
- Tab management works well digitally
- Reordering ease increases per-visit spending
7. Physical Space Requirements
 Kiosks require significant floor space; QR requires none
Space constraints affect feasibility, especially in urban locations.
Kiosk Space Requirements
Per-unit footprint:
- Kiosk itself: 3-4 square feet
- Customer standing zone: 6-9 square feet
- Queue space per position: 4-6 square feet
- Total per kiosk: 15-20 square feet minimum
3-kiosk deployment: 45-60 square feet
Location considerations:
- Near entrance but not blocking traffic
- Visible for natural discovery
- Power and network access
- ADA compliance for accessibility
QR Ordering Space Requirements
Total footprint: Zero
QR codes fit existing table space. No floor plan changes required. No electrical or network installations.
Space as Revenue
In urban restaurants, every square foot generates revenue:
- 20 square feet ×
$500/sqft annual rent =$10,000/year - That's
$833/month in implicit kiosk real estate cost
Add this to kiosk cost calculations for accurate comparison.
8. Technical Infrastructure Needs
 Both technologies need connectivity but kiosks require more robust infrastructure
Understanding technical requirements prevents implementation surprises.
Kiosk Infrastructure
Power requirements:
- Dedicated circuit recommended per 2-3 kiosks
- Power conditioning for consistent voltage
- Battery backup optional but smart
Network requirements:
- Wired Ethernet preferred (not required)
- WiFi works but less reliable
- Minimum 10 Mbps per kiosk
- Redundant connection recommended
Integration requirements:
- POS system compatibility
- Kitchen display system connection
- Payment processor certification
- Inventory system sync (optional)
QR Ordering Infrastructure
Customer connectivity:
- Guest WiFi strongly recommended
- Cellular backup works but varies
- No restaurant infrastructure required per se
System requirements:
- Standard internet connection
- POS integration (varies by platform)
- Kitchen routing (varies by platform)
The key difference: QR ordering works with customers' infrastructure. Kiosks require your infrastructure.
9. Maintenance and Reliability
 Kiosks require ongoing attention; QR systems are largely maintenance-free
Long-term operational burden differs significantly.
Kiosk Maintenance Reality
Daily tasks:
- Screen cleaning (multiple times daily)
- Surface sanitization
- Paper/receipt roll checks
- Visual inspection for damage
Periodic maintenance:
- Software updates
- Hardware calibration
- Deep cleaning
- Payment terminal certification
Common failure modes:
- Screen touch sensitivity degradation
- Payment terminal issues
- Connectivity drops
- Physical damage from customers
Realistic maintenance budget: $100-200/month per kiosk
QR Ordering Maintenance
Daily tasks:
- None
Periodic maintenance:
- Replace faded or damaged QR codes
- Update menu content
- Check for platform updates
Common failure modes:
- QR code becomes unscannable (rare, easy fix)
- Platform outages (provider responsibility)
- WiFi issues (restaurant infrastructure)
Realistic maintenance budget: $10-30/month total
Reliability Comparison
Kiosks introduce failure points you control. When they fail, you scramble. QR systems fail rarely, and failure modes are usually minor (customer uses phone data instead of WiFi).
10. Hybrid Approach: Using Both Technologies
 Many restaurants successfully deploy both technologies for different use cases
The choice isn't binary. Many restaurants deploy both technologies strategically.
Hybrid Deployment Scenarios
Fast casual with dine-in:
- Kiosks for counter ordering
- QR codes at tables for reorders
Casual dining with bar:
- QR ordering at restaurant tables
- Kiosk at bar for quick orders
Multi-format venues:
- Kiosks in quick-service area
- QR in seated dining area
Benefits of Hybrid
Customer choice: Different customers prefer different approaches. Offering both maximizes adoption.
Capacity management: Kiosks handle rush peaks; QR handles steady flow.
Use case optimization: Each technology where it works best.
Challenges of Hybrid
System integration: Both technologies must connect to your POS and kitchen systems.
Staff training: Teams must understand both systems.
Cost addition: You're paying for two solutions instead of one.
11. Making Your Decision: Framework
 Use this framework to guide your technology choice
Based on all factors, here's how to decide:
Choose Kiosks When:
Volume is high: 300+ transactions/day makes kiosk ROI attractive.
Service style is counter: Customers already approach a counter to order.
Space is available: 50+ square feet for 2-3 kiosks without revenue impact.
Budget allows: $15,000+ available for initial investment.
Demographic skews older: Customers more comfortable with provided devices.
Choose QR Ordering When:
Volume is moderate: Under 200 transactions/day where kiosk ROI is uncertain.
Service style is table: Customers sit before ordering.
Space is limited: No room for kiosks without losing revenue-generating space.
Budget is constrained: Under $5,000 available for technology investment.
Demographic skews younger: Customers comfortable with their own devices.
Consider Hybrid When:
Volume varies dramatically: Peak periods overwhelm but normal times don't justify kiosks alone.
Multiple service styles exist: Counter and table service in same venue.
Budget allows phased approach: Start with QR, add kiosks as volume grows.
12. Implementation Roadmap
 Both technologies follow different implementation timelines
Planning your deployment properly ensures success.
Kiosk Implementation Timeline
Week 1-2: Planning
- Finalize vendor selection
- Design floor plan placement
- Order hardware
Week 3-4: Infrastructure
- Install electrical (if needed)
- Set up network connections
- Configure POS integration
Week 5-6: Installation
- Hardware delivery and setup
- Software configuration
- Staff training
Week 7-8: Launch
- Soft launch with staff monitoring
- Customer assistance protocol active
- Feedback collection
Week 9+: Optimization
- Menu and upsell refinement
- Operational workflow adjustments
- Full deployment
Total timeline: 8-12 weeks
QR Ordering Implementation Timeline
Day 1-2: Setup
- Select platform
- Import menu content
- Generate QR codes
Day 3-4: Testing
- Test ordering flow
- Verify POS integration
- Train staff basics
Day 5-7: Launch
- Deploy QR codes to tables
- Monitor initial usage
- Address customer questions
Week 2+: Optimization
- Refine menu presentation
- Adjust workflows
- Expand capabilities
Total timeline: 1-2 weeks
Conclusion: Choose Based on Your Reality
 Choose based on your restaurant's needs
Both self-service kiosks and QR ordering deliver real benefits. Kiosks provide larger average check increases and stronger upselling, but require significant investment and physical space. QR ordering offers faster implementation, lower costs, and better fit for table-service environments.
The right choice depends on:
- Your restaurant type and service model
- Available budget and space
- Customer demographic preferences
- Volume and growth projections
Start with honest assessment of these factors rather than technology preferences. The best solution is the one your specific customers will actually use.
Ready to explore specific platforms? Check our QR menu software comparison for detailed platform analysis, or our digital menu ROI calculator to build your business case.
Analysis based on industry data and restaurant deployments as of February 2026.
More Articles
AI-Powered Restaurant Inventory Forecasting: Reduce Waste and Boost Profits
Discover how AI inventory forecasting predicts demand, optimizes orders, and reduces food waste. Machine learning tools for smarter restaurant inventory management.
Appetito Menu Review: Multilingual QR Menus for Restaurants
Complete Appetito Menu review covering multilingual QR menu features, pricing, setup process, and how it compares to Fuudey, Menu Tiger, and alternatives.
Best Free QR Code Menu Generator in 2025 (7+ Reviewed)

We tested 8 free QR code menu generators including Fuudey, QR Menu Creator, Menuu, ScanIt.menu, and more. Full comparison with pricing, features, and honest reviews.